

In this post I will build upon the use of eigenportfolios to analyze recent market action. The prospect of more severe tariffs and tariff retaliation from China have resurfaced in recent days. This comes at the same time as a prolonged government shutdown. If tariffs are too severe they are deflationary. If they are small enough to be passed through without inflicting a demand elasticity response, then they will likely be inflationary as the prevailing narrative suggests.
Since October 1st the government has been shut down so there is a dearth of economic data available. This post will also dive deeper into market dynamics since the shut down began. The deflationary shock we are about to analyze is nested within a market dynamic of overall stagflation and deep uncertainty about the future outlook. The soaring price of Gold reflects this uncertainty. It serves as an excellent example of how narratives can be implicitly derived from market dynamics.
Since markets actually are efficient, the price itself tells you what the narratives are and the story of their conflicting views on future macroeconomic scenarios. Reflexivity means the price action is as much the thing doing the forecasting as it is the thing to be forecasted. Price action in a certain direction becomes emphasized through feedback loops.
Volatility exists because over long enough time frames the market is habitually wrong and needs to adjust in the face of a changing world. The market is highly efficient with respect to the present moment and near future but the passage of time raises the prospect of inefficiency.
A Deflationary Shock
In the previous piece on stagflation we noticed that the shape of the data showed the principal eigenvectors associated with Gold outperforming. Gold has continued to outperform showing that it has genuine risk off characteristics.
Within this stagflation backdrop, the recent tariff news has added an empirically discoverable shift in the data, a single day where all the eigenvectors derived from PCA shift. Their covariances change which shows up in stock to bond correlation reverting back to deflationary dynamics instead. That is where bonds offset stock losses instead of vice versa.
In recent years higher yields have been correlated both with stock selloffs as in 2022 as well as with higher stock prices in an era of fiscal dominance and financial repression (QE). That dynamic challenges the notion of a diversified 60/40 portfolio since bonds do not offer much protection during equity bear markets. However for a single day we saw the classical dynamic restored bonds rallied while equities fell.
Charts below are produced using the same script from the previous article on stagflation, just using different dates. I also add another minor adjustment which is to drop the top eigenportfolio that represents the market portfolio. This allows us to go one step deeper into the list of factors.
The charts below show the distributional properties of eigenportfolio performances for the two time periods. A simple vector of four asset class proxies is used:
[“SPY”, “USO”, “GLD”, “TLT”](Market Dynamics - October 10th)
After dropping the market portfolio the top performing eigenportfolio is Eigenportfolio 3 which is most heavily weighted in TLT. The worst performer is the SPY and USO heavy portfolio, Equities and Oil are two asset classes that you would expect to do poorly during a growth shock.
It is worth noting that bonds rallied at the same time that stocks sold off on that very volatile day, a signature of deflationary dynamics.
Top 3 Eigenportfolio Weights (Long-Only Normalized):
Eigenportfolio 1: [0.196 0.178 0.482 0.143]
Eigenportfolio 2: [0.502 0.39  0.071 0.038]
Eigenportfolio 3: [0.15  0.114 0.089 0.647]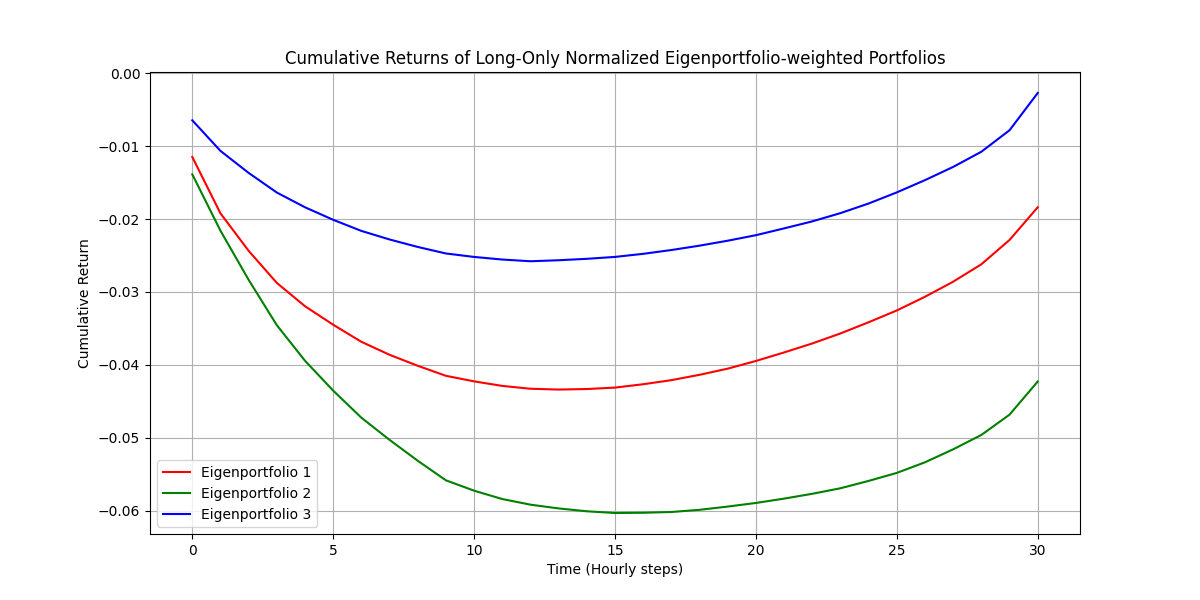
(Market Dynamics - October 1st through Today)
Over the period since the government shutdown has begun, the eigenportfolio most heavily weighted in GLD has continued to outperform, strengthening the case for stagflationary dynamics overall. A portfolio heavily weighted in TLT is a close runner up, reflecting the conflicting outlook.
Top 3 Eigenportfolio Weights (Long-Only Normalized):
Eigenportfolio 1: [0.068 0.327 0.54  0.064]
Eigenportfolio 2: [0.608 0.193 0.018 0.181]
Eigenportfolio 3: [0.125 0.144 0.141 0.59 ]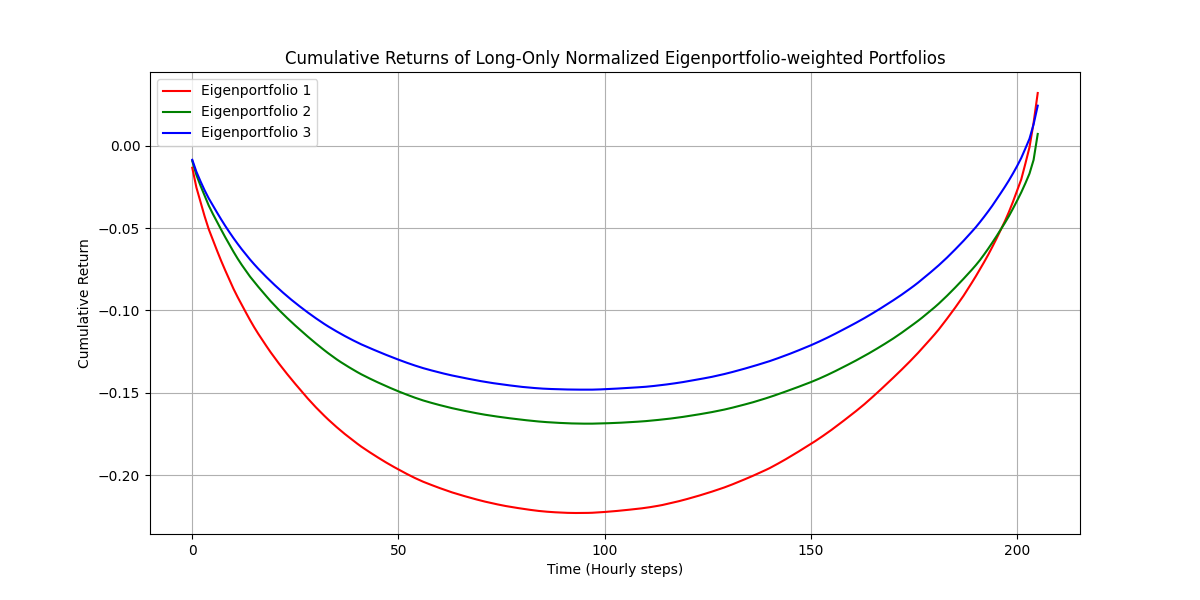
Source code:
https://github.com/regimelab/the-shape-of-deflation/
Game Theory
Why is the prospect of more severe tariffs deflationary? Because China and the US are highly interdependent economic partners, and both sides know this. Both sides also know that both sides know.
Our global economy depends on production and consumption and the free trade of goods and services. The US is highly dependent on China for critical commodities like rare earths and critical materials for our technology supply chain. We need these very things to protect ourself from China, the narrative goes.
Suddenly shutting down trade because prices are too high to bear repeats a scenario much like the Covid lockdowns. Consumption grinds to a halt out of necessity and deflationary feedback processes take over.
While we are told we are in a race against China, we are simultaneously dependent on them. Raising the prospect of a more severe tariff war is like upping the ante in a game of poker. One side invokes it's leverage which necessitates the other side to follow suit, until a resolution is found or the situation escalates to a tipping point.
References & Further Reading
PCA Scikit-Learn
Unemployment Rate Federal Reserve
Managing Risks in a Risk-On/Risk-Off Environment Marcos Lopez de Prado
Principal Eigenportfolios for U.S. Equities Marco Avallaneda, Brian Healy, Andrew Papanicolaou, George Papanicoalou
Trump announces 130% tariffs on China. The global trade war just came roaring back CNN